Nov 8, 2022
Lab Guide: Grafana Dashboard
Let us understand the component in monitoring stacks, often used in combination with time series databases.
Author


Book a call
Table of Contents
How to Monitor Multiple Servers with Grafana on a Single Dashboard?
To monitor many servers from a Single Grafana Dashboard, we need to install the Agent on each Server that we need to monitor and the database in a server which is required to store live data.
We will be using:
- InfluxDb [ Database ]
- Telegraf [ Monitoring agent ]
- Grafana [ Graphical representation of the server metrics ]
InfluxDB
InfluxDB is purpose-built for time series data. Relational databases can handle time series data, but are not optimized for common time series workloads. InfluxDB is designed to store large volumes of time series data and quickly perform real-time analysis on that data. Grafana is a visualization tool for time series data.
Telegraf
Telegraf is a server-based agent for collecting all kinds of metrics for further processing. It's a piece of software that you can install anywhere in your infrastructure and it will read metrics from specified sources application logs, events, or data outputs.
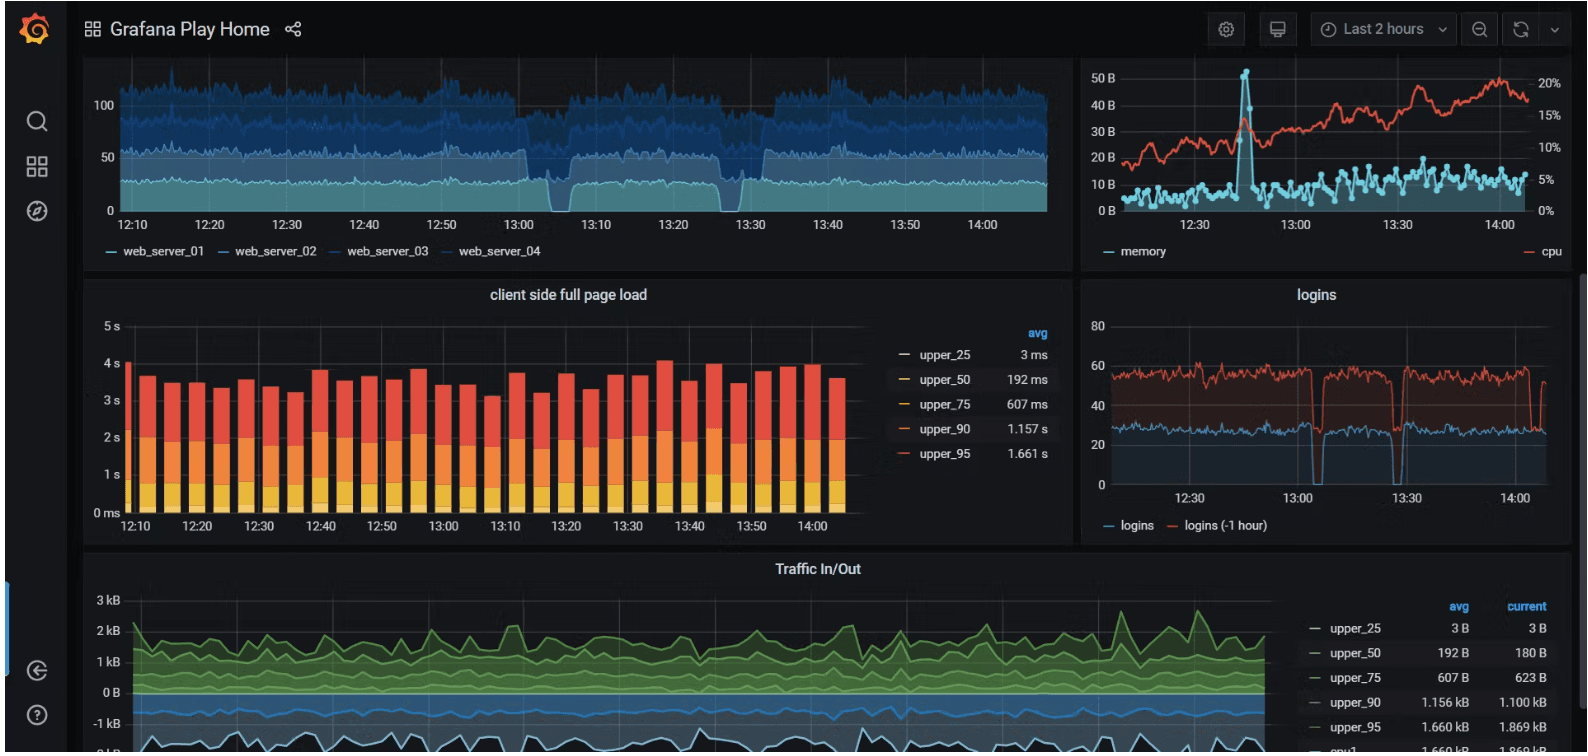
Grafana Dashboard
A Grafana dashboard is a powerful open source analytical and visualization tool that consists of multiple individual panels arranged in a grid. The panels interact with configured data sources, including (but not limited to) AWS CloudWatch, Microsoft SQL server, Prometheus, MySQL, InfluxDB, and many others.
Steps to Set Up Dashboard
For this, we are using two servers:
- In server01 we shall be installing Grafana, InfluxDb, and Telegraf.
- In server02 we shall be installing Telegraf.
Under server01
Add and Install the InfluxDB, required packages, and Telegraf Repositories.
Install the following prerequisites packages to all the server.
Install Infuxdb
Create User and Database to store the Data from Telegraf Agent.
Install in all the server you need to monitor `Telegraf Agent: Installation and the configurations.`
Change hostname.
Configure Telegraf.
In this step, we will configure the Telegraf to use basic input plugins for collecting system metrics of the server, and using the influxdb as the output plugin.
Manage Configuration
Telegraf provides telegraf command to manage the configuration, including generate the configuration itself, run the command as below.
Install Grafana-Dashboard
Login to Grafana and go to dashboard.
Add the InfluxDB as Data Source.
Under Server02 - Ubuntu.
Follow the above command to add monitoring agent and configure to monitor server02.
This shall land you with the desired results. Hope you had a good read!
Related Articles.
More from the engineering frontline.
Dive deep into our research and insights on design, development, and the impact of various trends to businesses.

May 28, 2026
How to Modernize Your Fintech App Without Rebuilding Everything
This blog gives fintech leaders a practical framework for modernizing a fintech app without rebuilding it. It covers system audits, module-level decision making, phased API and integration-led execution, compliance protection, and team model selection.

May 28, 2026
Why Your First AI Pilot Needs Success Metrics Before Development Begins
95% of AI pilots deliver zero measurable profit impact. Learn the critical importance of establishing concrete success metrics and operational constraints before writing any code to ensure your project scales.

May 28, 2026
AI in WealthTech: Building Scalable Portfolio Management Platforms for Predictive Investing and Risk Forecasting
Discover how AI-native platforms are revolutionizing WealthTech by enabling real-time, predictive investing and advanced risk forecasting. Learn the core operational pillars and engineering priorities for building a scalable portfolio management system.