Table of Contents
Optimizations in React Native
Author

Date

Book a call
I've observed that we frequently overlook relatively simple React component performance optimizations. I'll review a few quick solutions to fundamental performance issues in this piece. Let's get started.
List Optimisation
When rendering a long list, FlatList is the go-to tool. However, there are some performance issues even though it offers excellent control via the removedClippedSubviews, maxToRenderPerBatch, windowSize and getItemLayout props.
But look no further because here comes the rescue!
FlashList
FlatList and FlashList seem similar and have similar syntax. If you are familiar with the FlatList properties, there won't be many changes.
Do you see how simple that is?
FlashList uses this estimatedItemSize to compute how many items should be drawn on screen before the initial load and when scrolling.
How does it work? Well, instead of destroying the component when an item gets out of the viewport, FlashList re-renders the same component with different item props. Another thing to keep in mind while using FlashList is to avoid adding key props to the item component, which React recommends. It will prohibit views from being recycled, negating all of the advantages of FlatList.

Functions as Props
We have a Parent component that has a Child component in the code snippet below. To keep this article brief, I will not discuss how the Child component is constructed. Instead, we must suppose that our Child component is large and resource intensive. As a result, we must exercise caution in how we approach a few issues. Let's start with the code:
Everything looks fine, right?
Not really; we are missing something fundamental here.
Because the Child component is expensive, we don't want it to have unnecessary re-renders. What are we going to do about it, then? Yes, you guessed it, we will use React.memo(). Now, we are wrapping our Child component with memo that will return a memoized React component, allowing us to use the memoized child component in our Parent component.
Because our heavy component is now memoized, we may anticipate the Child component to not re-render excessively; however, that is not the case. Why?
It is because React.memo() compares props shallowly, and we are supplying an update function as props, which will have a new reference on each re-render of the Parent component. To avoid this, we must also memoize the function. Previously we were passing a function directly as props. But now we are wrapping the same function with useCallback, which will return a memoized function. It's reference would not change across re-renders of the Parent component.
This will help our memo to compare and prevent further re-rendering of the Child component.
The component and the function have both been memoized. A quick visual comparison will help you understand better. Carefully notice the console logs.
without any memoization
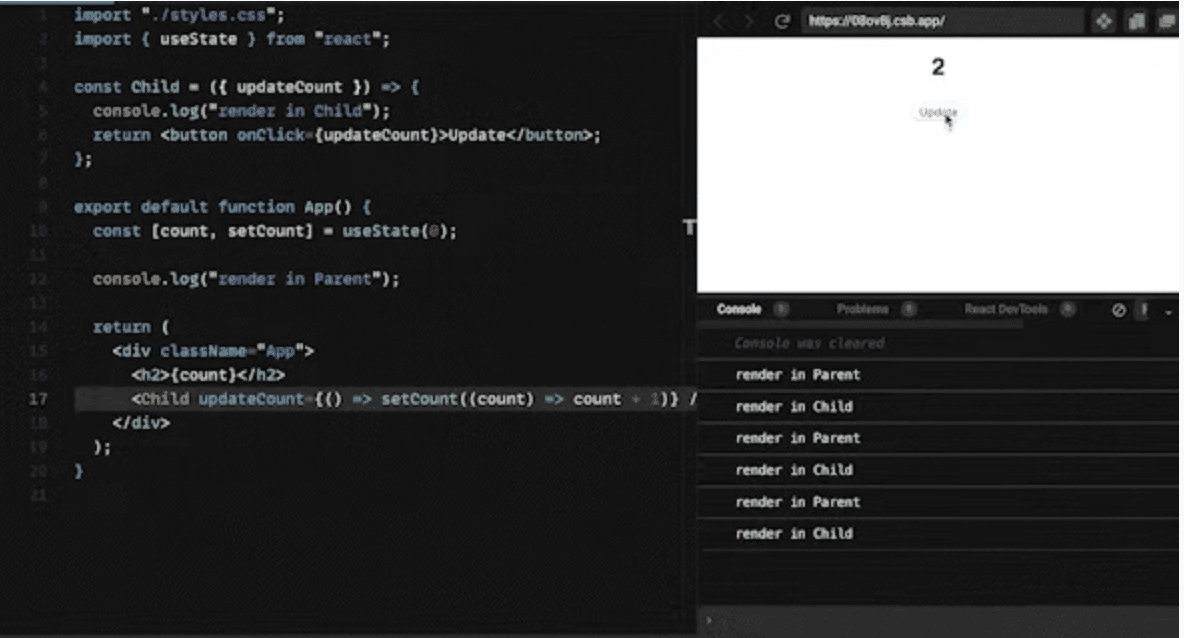
As you can see, when the state of the Parent component changes, the Child component also renders
with memoization
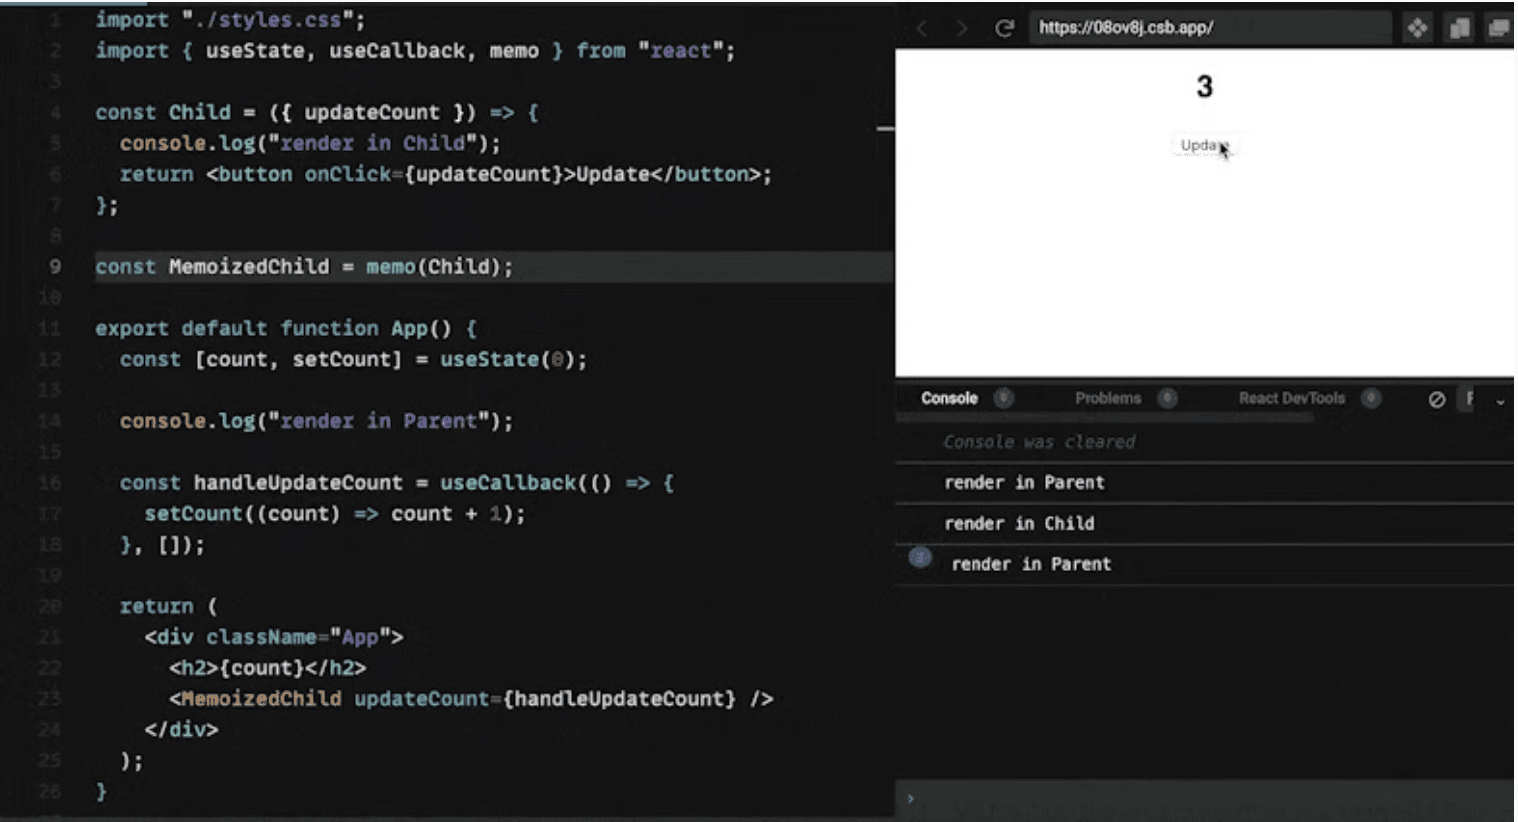
Only the Parent component is now rendered on each state update.
Image Optimisation
Too many large picture assets can raise the size of the app bundle, and the time it takes to load such images. Images in jpeg and png formats can be rather large. We may use webp instead. The following are some advantages:
- Reduces image size by 25-34%
- Supports both lossy and lossless compression modes
- Supported on Android 4.2.1 or higher
- Supported on iOS 14 or higher
If you're familiar with browser caching, you'll know that after an asset is downloaded, it may be cached locally for a set period. Until then, successive requests to the same URL will not retrieve the asset from the server but will be served from the cache. This aids in the faster loading of materials from frequently visited pages.
To achieve similar caching on both Android and iOS, we can use this excellent package.
react-native-fast-image
- Fairly simple API
- Have priority options
- Supports preload
- Supports memory and disk cache clearance features
Here is an essential component for rendering an image with FastImage. We must provide a URL, a priority, and any necessary headers. And, of course, the image size. That is sufficient to have a cached image component.
You can even preload some images before you visit the next screen.
Using Hermes
Hermes is an open-source JavaScript engine created to ramp up app launch time. It's pretty simple to use and is the default engine in react-native v0.70. Hermes comes with this set of features:-
Adapting Trash Collection
Improved garbage collection processes that prevent the operating system from terminating the app due to inadequate memory on low-end devices. A few examples of garbage collection techniques are:
Replacing JIT (just-in-time) Compiler with AOT (ahead-of-time) Compiler
Significantly reduces load time. JIT parses and compiles code at runtime to begin execution. This causes delays when loading. In AOT, both parsing and compilation are shifted to the build process. This means both jobs will be performed while developing the app. Yes, it will lengthen the build time, but it is still better than a slower load time.
Precompiling Source Code into Bytecode
A Javascript engine will parse the source after it is loaded, generating bytecode. This step delays the execution process. Precompiling source code into bytecode during build time helps in improving the load time by a greater margin.
Setting up Hermes is very simple. This is how you can enable Hermes
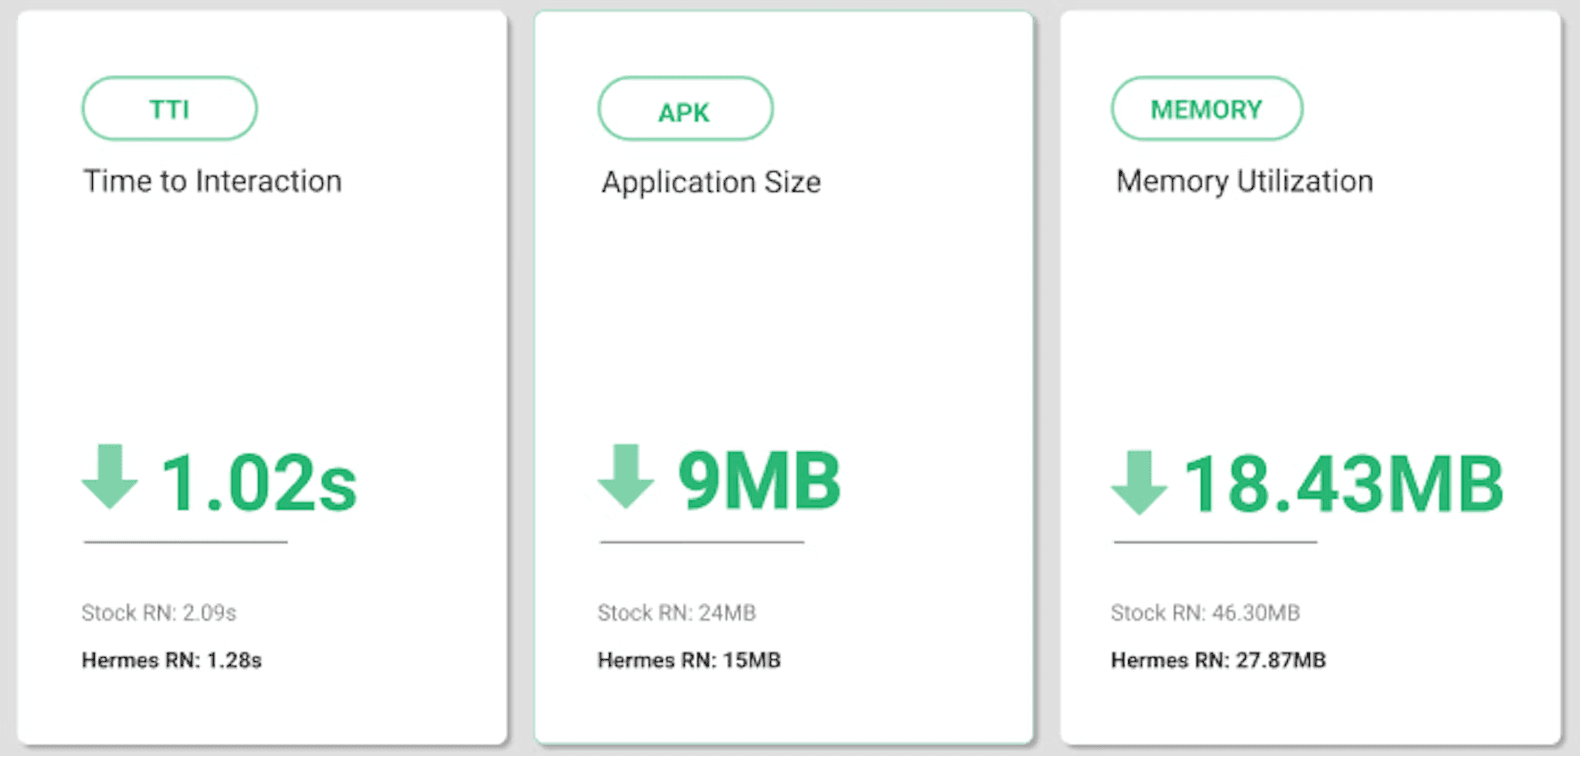
This is what we get after enabling Hermes.
Inline Styles
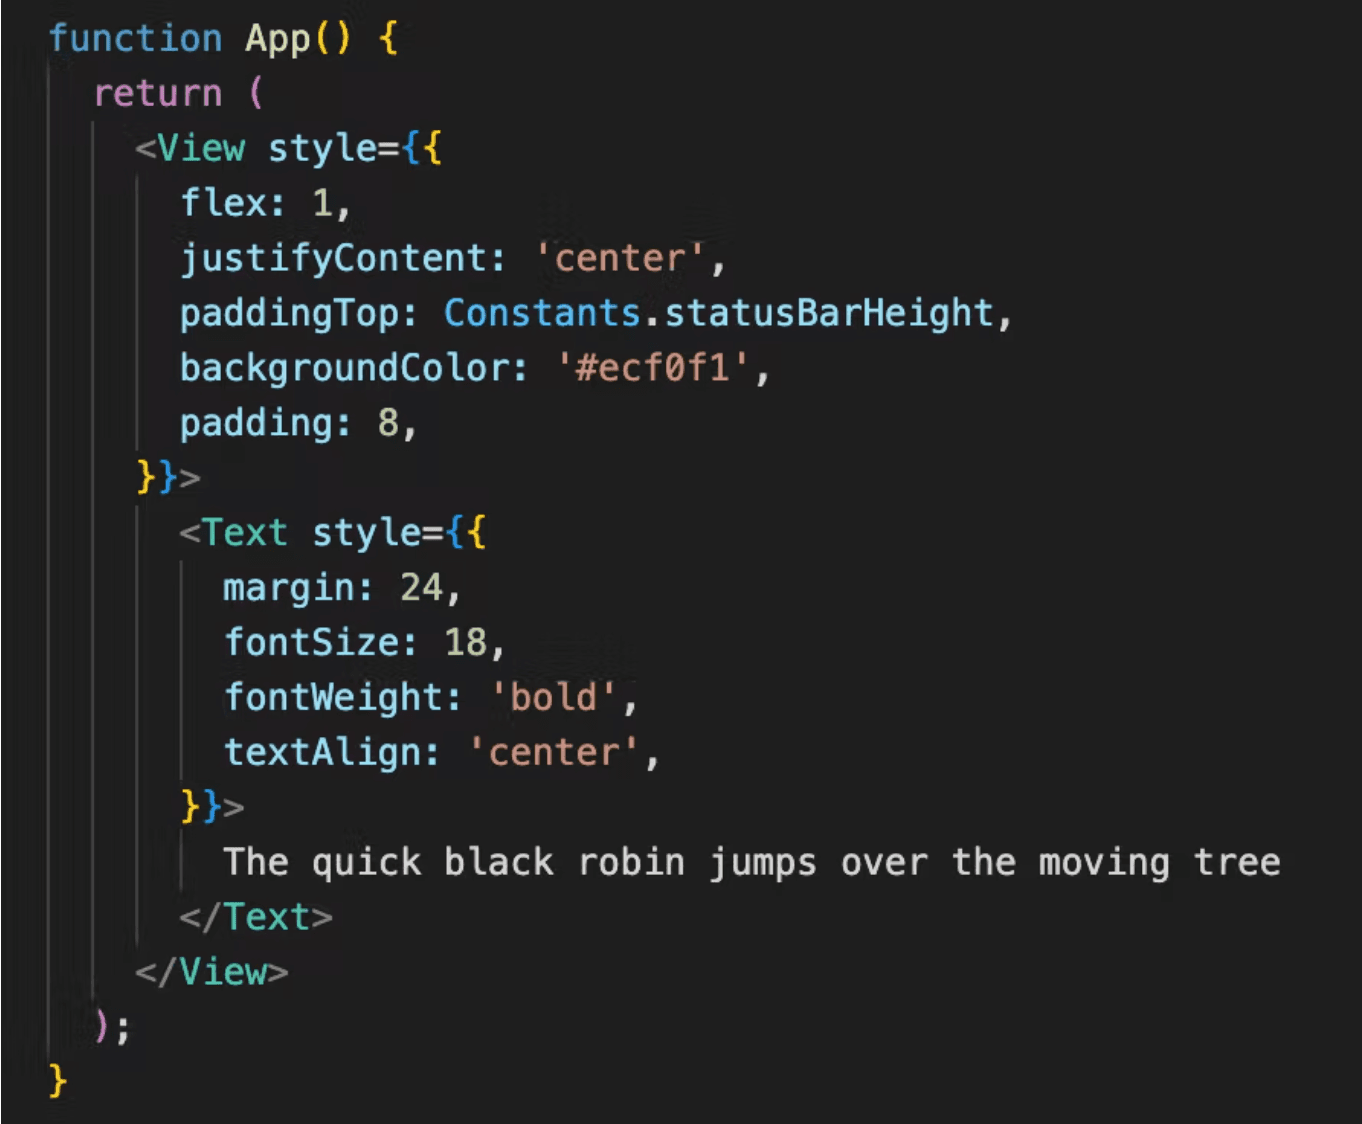
In our component, we must avoid using inline styles. Because these inline styles send new object references on each re-render, they can impact performance.
In this code, we pass objects directly in the JSX styles.
Instead, we must use StyleSheet Object and send a reference to it to the styles prop. Now on each re-render, a new object won't be created. The same reference will be passed.

Reduce Android App Size
A large app size might also be an issue, especially for low-end Android devices. However, there are techniques to reduce its size dramatically.
Android App Bundle (.aab)
Instead of creating a universal apk to support all the CPU architectures, such as armeabi-v7a, arm64-v8a, x86, x86_64, we can generate a .aab file.
An app with just a single page and text will be around 25MB for it’s .apk file. A .aab file for the same would be around 3MB. These two lines of syntax can help you achieve that!
Enable Resource Shrinking
As the name suggests, resource shrinking categorizes and removes unnecessary resources. Make this change in the android/app/build.gradle file.
Enable Proguard
Proguard helps in obfuscating our code, which makes reverse engineering of our bundle more difficult. Apart from that, it also helps in reducing the app size.
To enable proguard, set the following in android/app/build.gradle file to true.
Add your proguard rules in android/app/proguard-rules.pro file. Here is a preview of the same.

Bundle Visualiser
Using this tool, we can determine the bundle size of each package in our application. The bundle visualiser shows which package uses the most space in our bundle. You wouldn't want to send the client a bulky package; therefore, perhaps there's a better way for the same package that doesn't add as much code to the bundle.
We have an excellent tool for that in react-native-bundle-visualizer which is very easy to integrate and run.
The information above makes it apparent which module is occupying the most space. Once you've located the largest bundle, you may determine whether or not to replace it by looking attentively.
Console Statements
Console.log() is used a lot. According to statistics, we utilise console.log() more than debugger. But why is that the case? Well, in production, too many console statements can lead to poor performance.
Should we abandon the console statement entirely? Not really, instead, we have a plugin that can remove all of our console statements from the production build. What a fantastic idea!!!
We can use this babel plugin babel-plugin-transform-remove-console
Installation
Babel configuration file
Performance Monitoring
To maintain a better watch of our apps, we need a tool that can offer better insights and data. Such instruments are accessible to us. Here are a few examples:
- Sentry.io
- Firebase performance monitor
- React-native-performance-monitor
- Instabug
In this section, I'll be showing you an example of Firebase performance monitoring. We can use this React Native Firebase module. The installation and configuration can be found at the aforementioned URL. It's quite basic.
Let's take a look at the analytics board in the Firebase console.
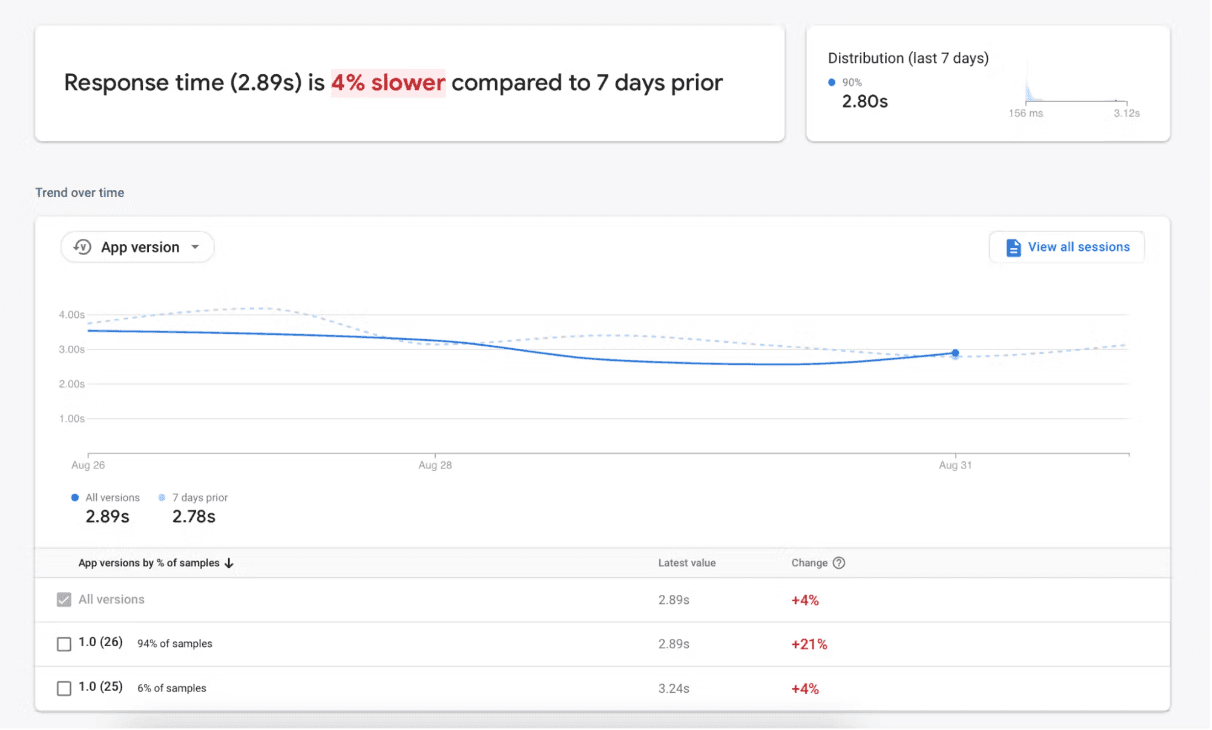
This data pertains to an API endpoint utilised in the app. We can observe that it is 4% slower than it was 7 days ago. This level of detail can assist you in guiding and pinpointing the source of the problem.
Conclusion
We learned that a few simple tools and a different approach of coding may significantly improve our performance. We can use the majority of these from the start of our development. It might be tough to resolve key performance concerns, but to proceed with the best remedy, we must first identify the problem at its root. These instruments will undoubtedly provide us with some advantages.
Would love to learn about any additional helpful tools from you guys.
Dive deep into our research and insights. In our articles and blogs, we explore topics on design, how it relates to development, and impact of various trends to businesses.